
Data preparation
Normalize raw instrument output, organize it into a group → sample tree, and verify table parsing before plotting, analysis and export.
1. Supported formats
Use Import files above the raw data panel or drag files into the empty left panel.
- Tables and spreadsheets:
.csv,.xlsx,.xls. - Instrument text:
.txt,.dat,.xy,.asc.
2. Import parameters
The import configuration dialog lets you adjust instrument headers and parsing.
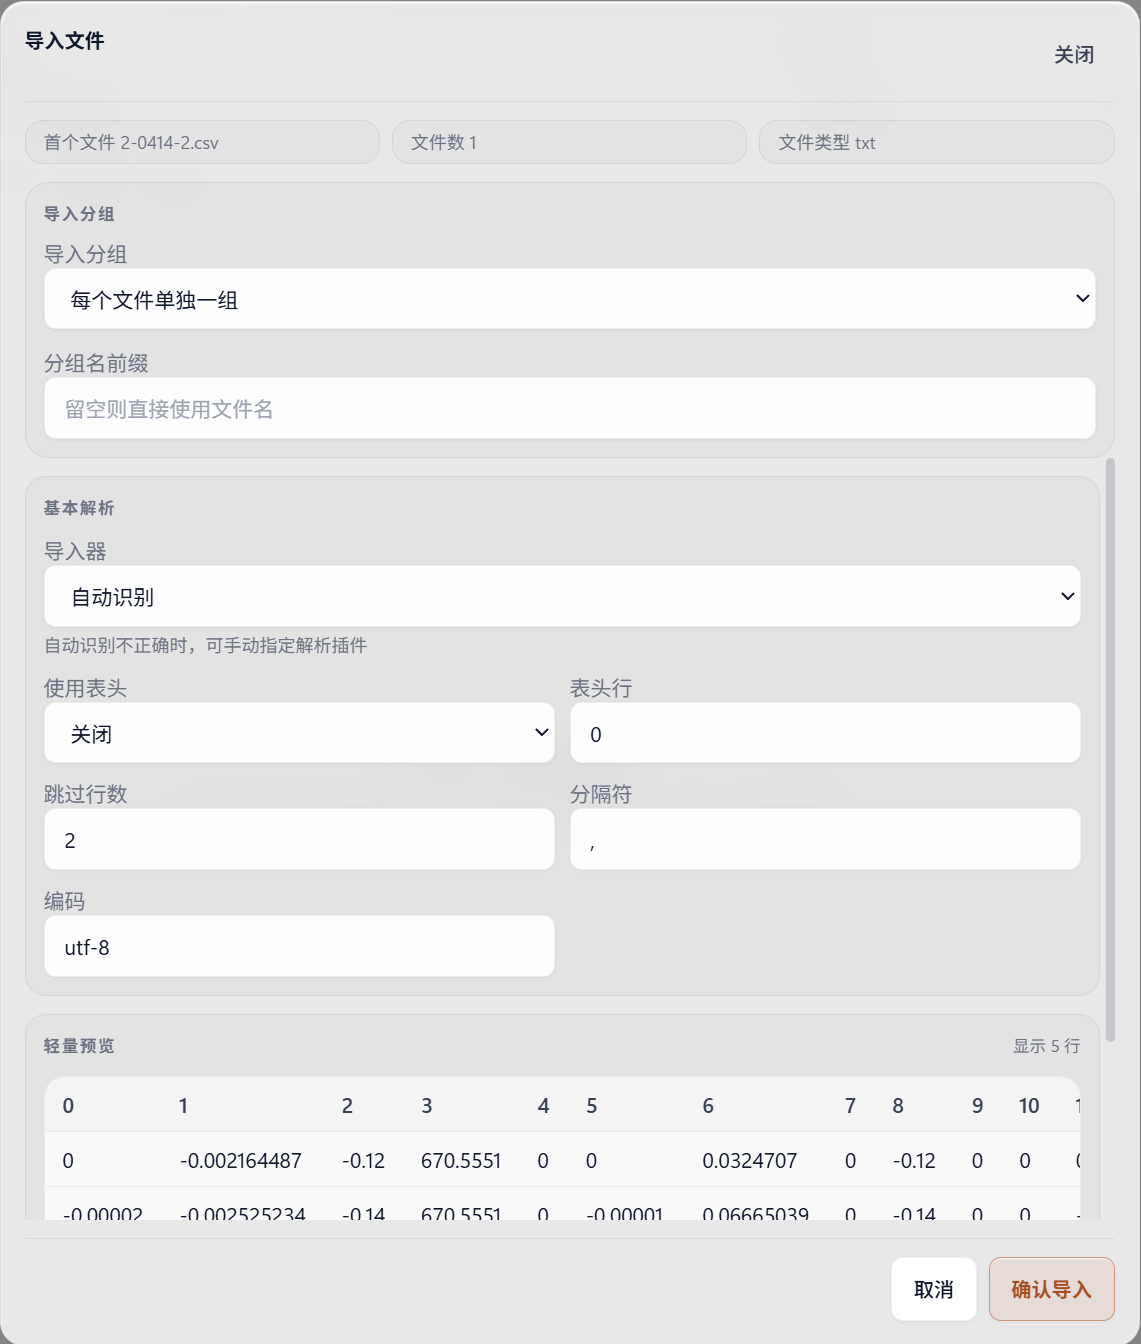
- Encoding and delimiters: automatic detection can be adjusted. If text is garbled, try the appropriate encoding, such as UTF-8 or GBK. Check comma, tab or space delimiters.
- Skip lines: bypass instrument metadata to reach the numeric region.
- Header line: identify column names and check their alignment in the first-five-row preview.
3. Excel worksheets
- Use Preview Sheet to inspect worksheets in a multi-sheet workbook.
- Current Sheet imports only the displayed worksheet as one workspace sample.
- All Sheets imports each worksheet as a separate workspace sample and creates the corresponding parent group.
4. Sample tree and table workspace

- Right-click samples to rename or delete them. Drag into empty space to create a group, or onto an existing group to move them.
- Double-click cells to edit or clear values. Preserve raw files and document the basis for correcting apparent instrument errors.
WARNING
Check whether you are editing a group or an individual sample. Group-level column transformations and data edits apply to all samples in the group. Select the specific current sample when only that item should change.
5. Troubleshooting
- Misaligned headers usually indicate incorrect delimiters or skipped lines. Inspect the original file and adjust the settings.
- Only the seven listed formats are accepted. Export proprietary or encrypted instrument files as standard TXT or CSV in the instrument software first.
6. Next step
After checking imported data, continue to processing workflows to build a reusable pipeline and produce figures.